Client reporting without the rebuild
Describe the report. Fine-tune in the editor.
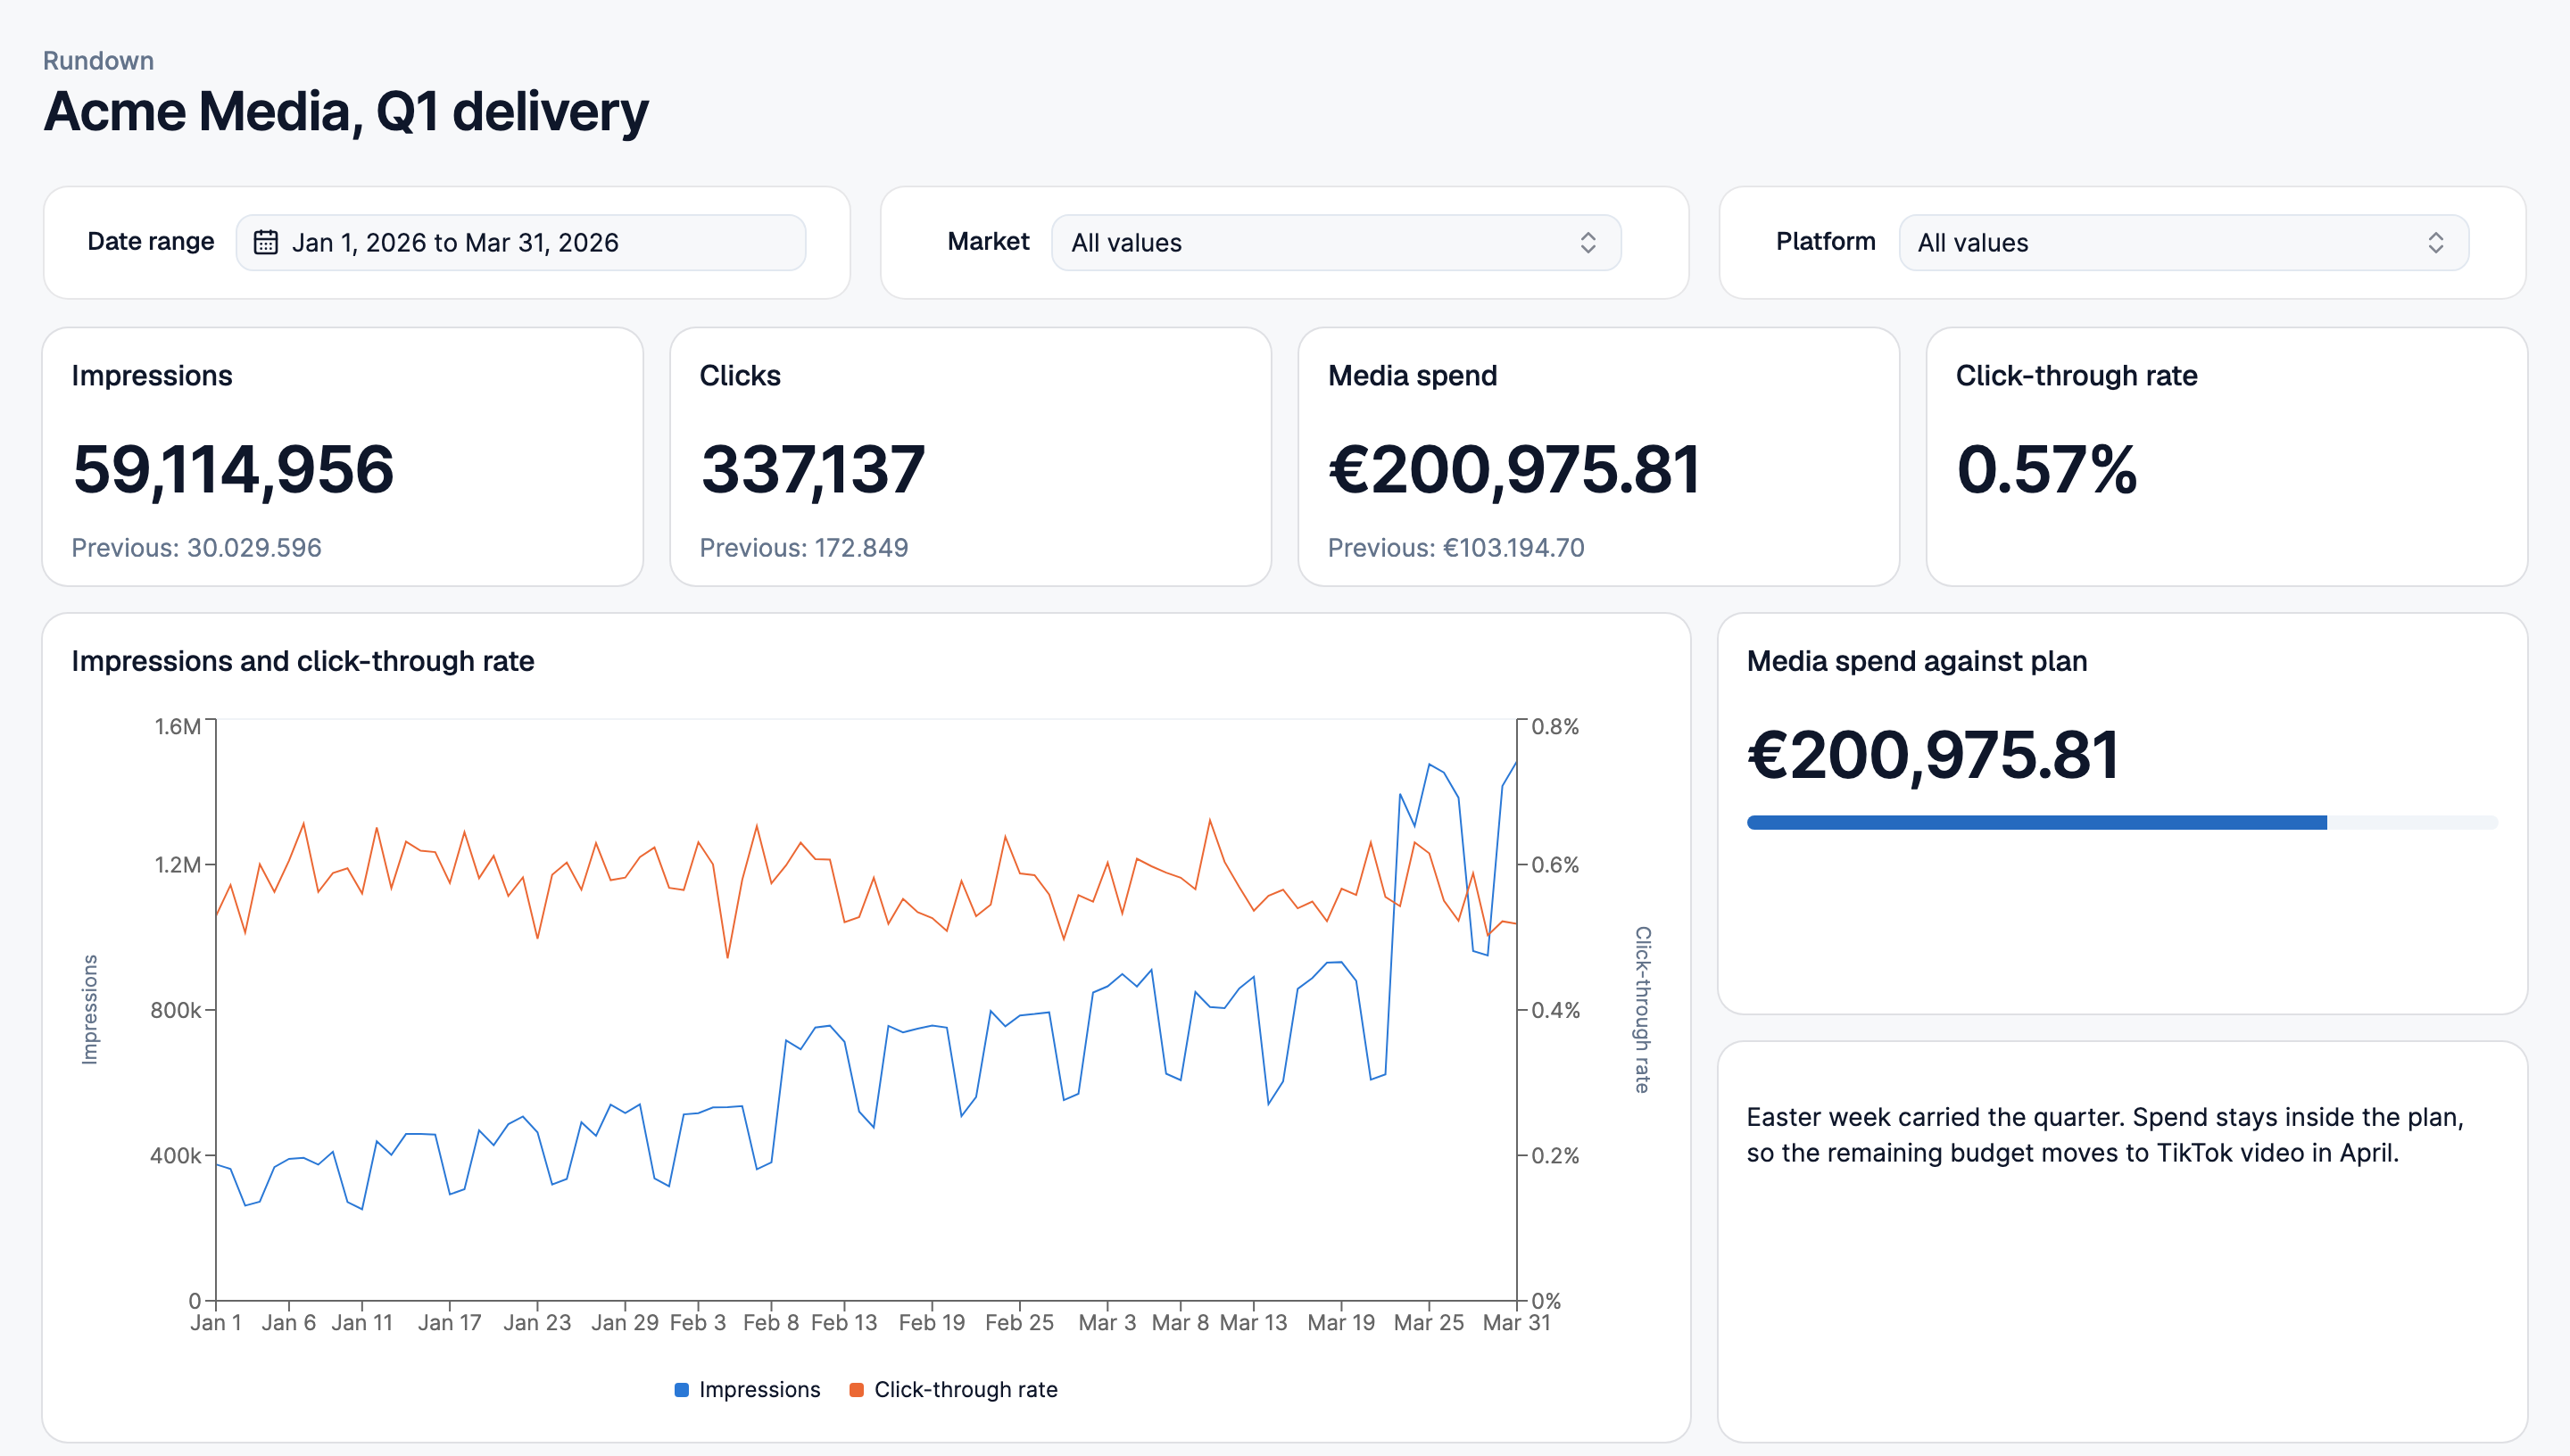
Rundown turns reporting intent into query-backed dashboards while keeping every formula, filter, and access rule inspectable.
Agents build, you adjust
Every action in the GUI is also a site tool, so an agent can assemble the first draft and you correct it by hand.
Queries stay readable
Widgets compile to SQL over your own CSV and parquet files. No copies, no hidden transforms, no second warehouse.
Share without seats
Send a link or grant a colleague access. Viewers get the stored widgets and controls and nothing else.
Every breakdown the report needs
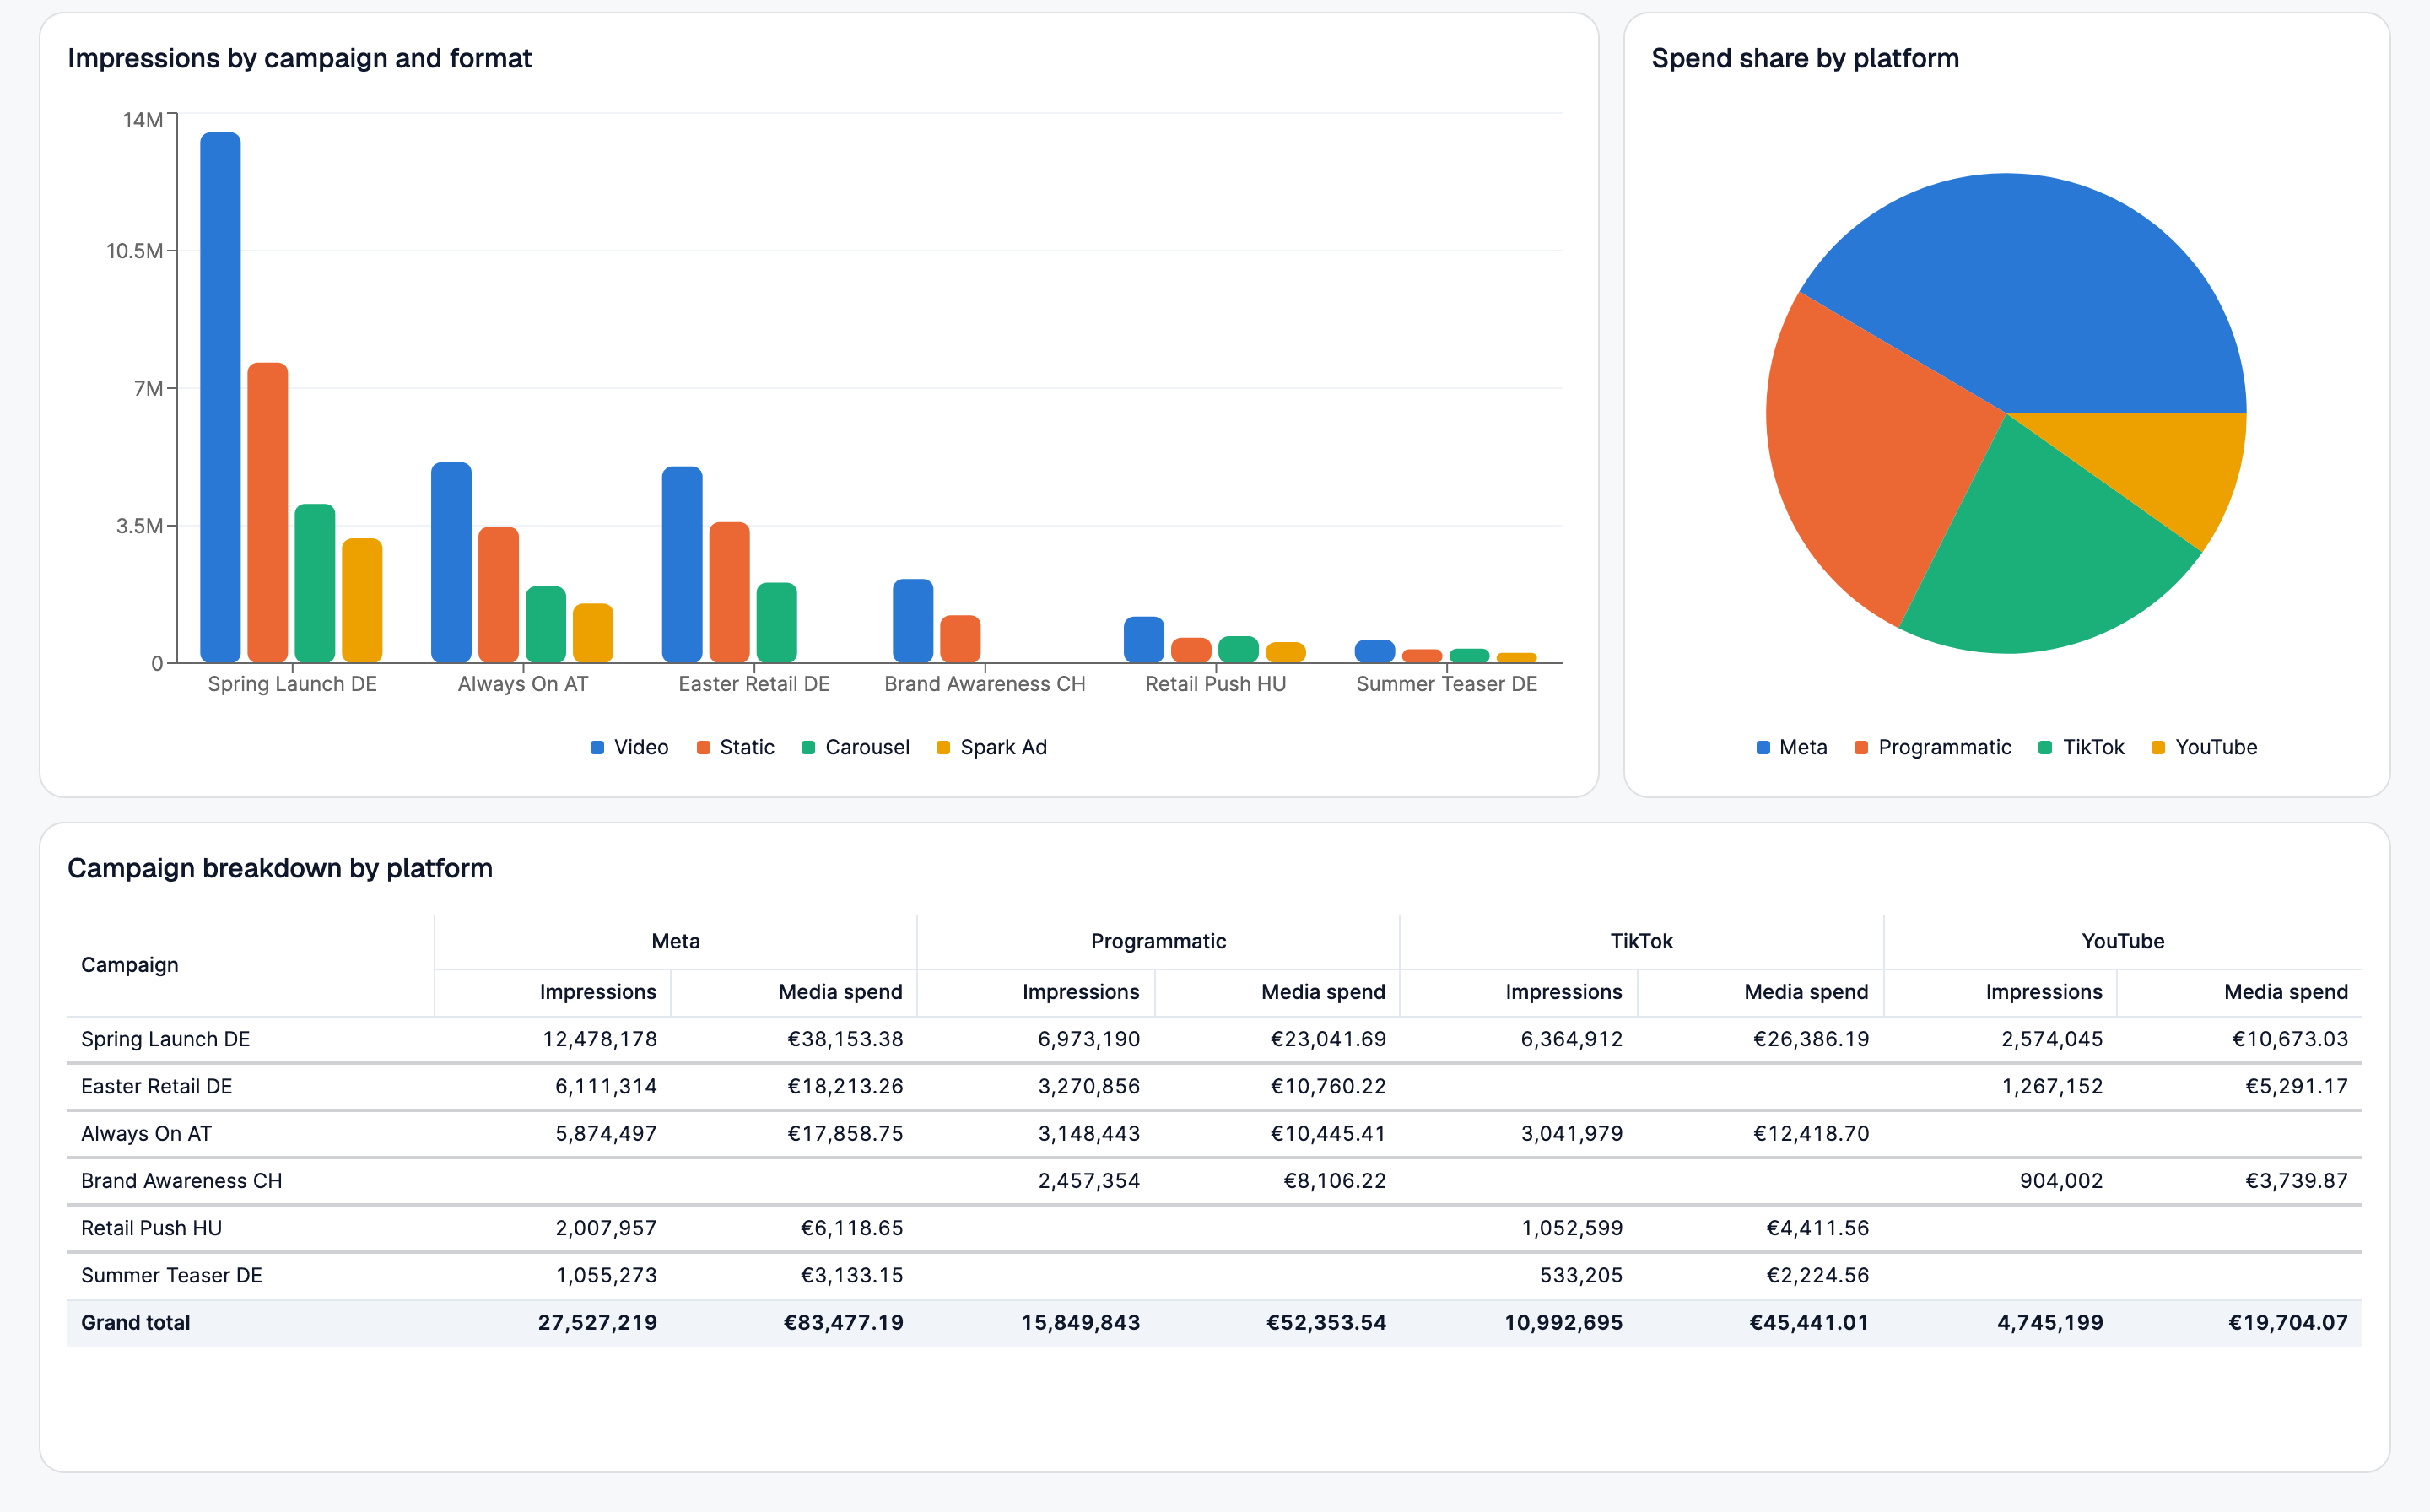
Grouped bars, share of spend and a pivot table with totals run on the same query. One date range and one filter set drive all of them.
Field metadata stays yours
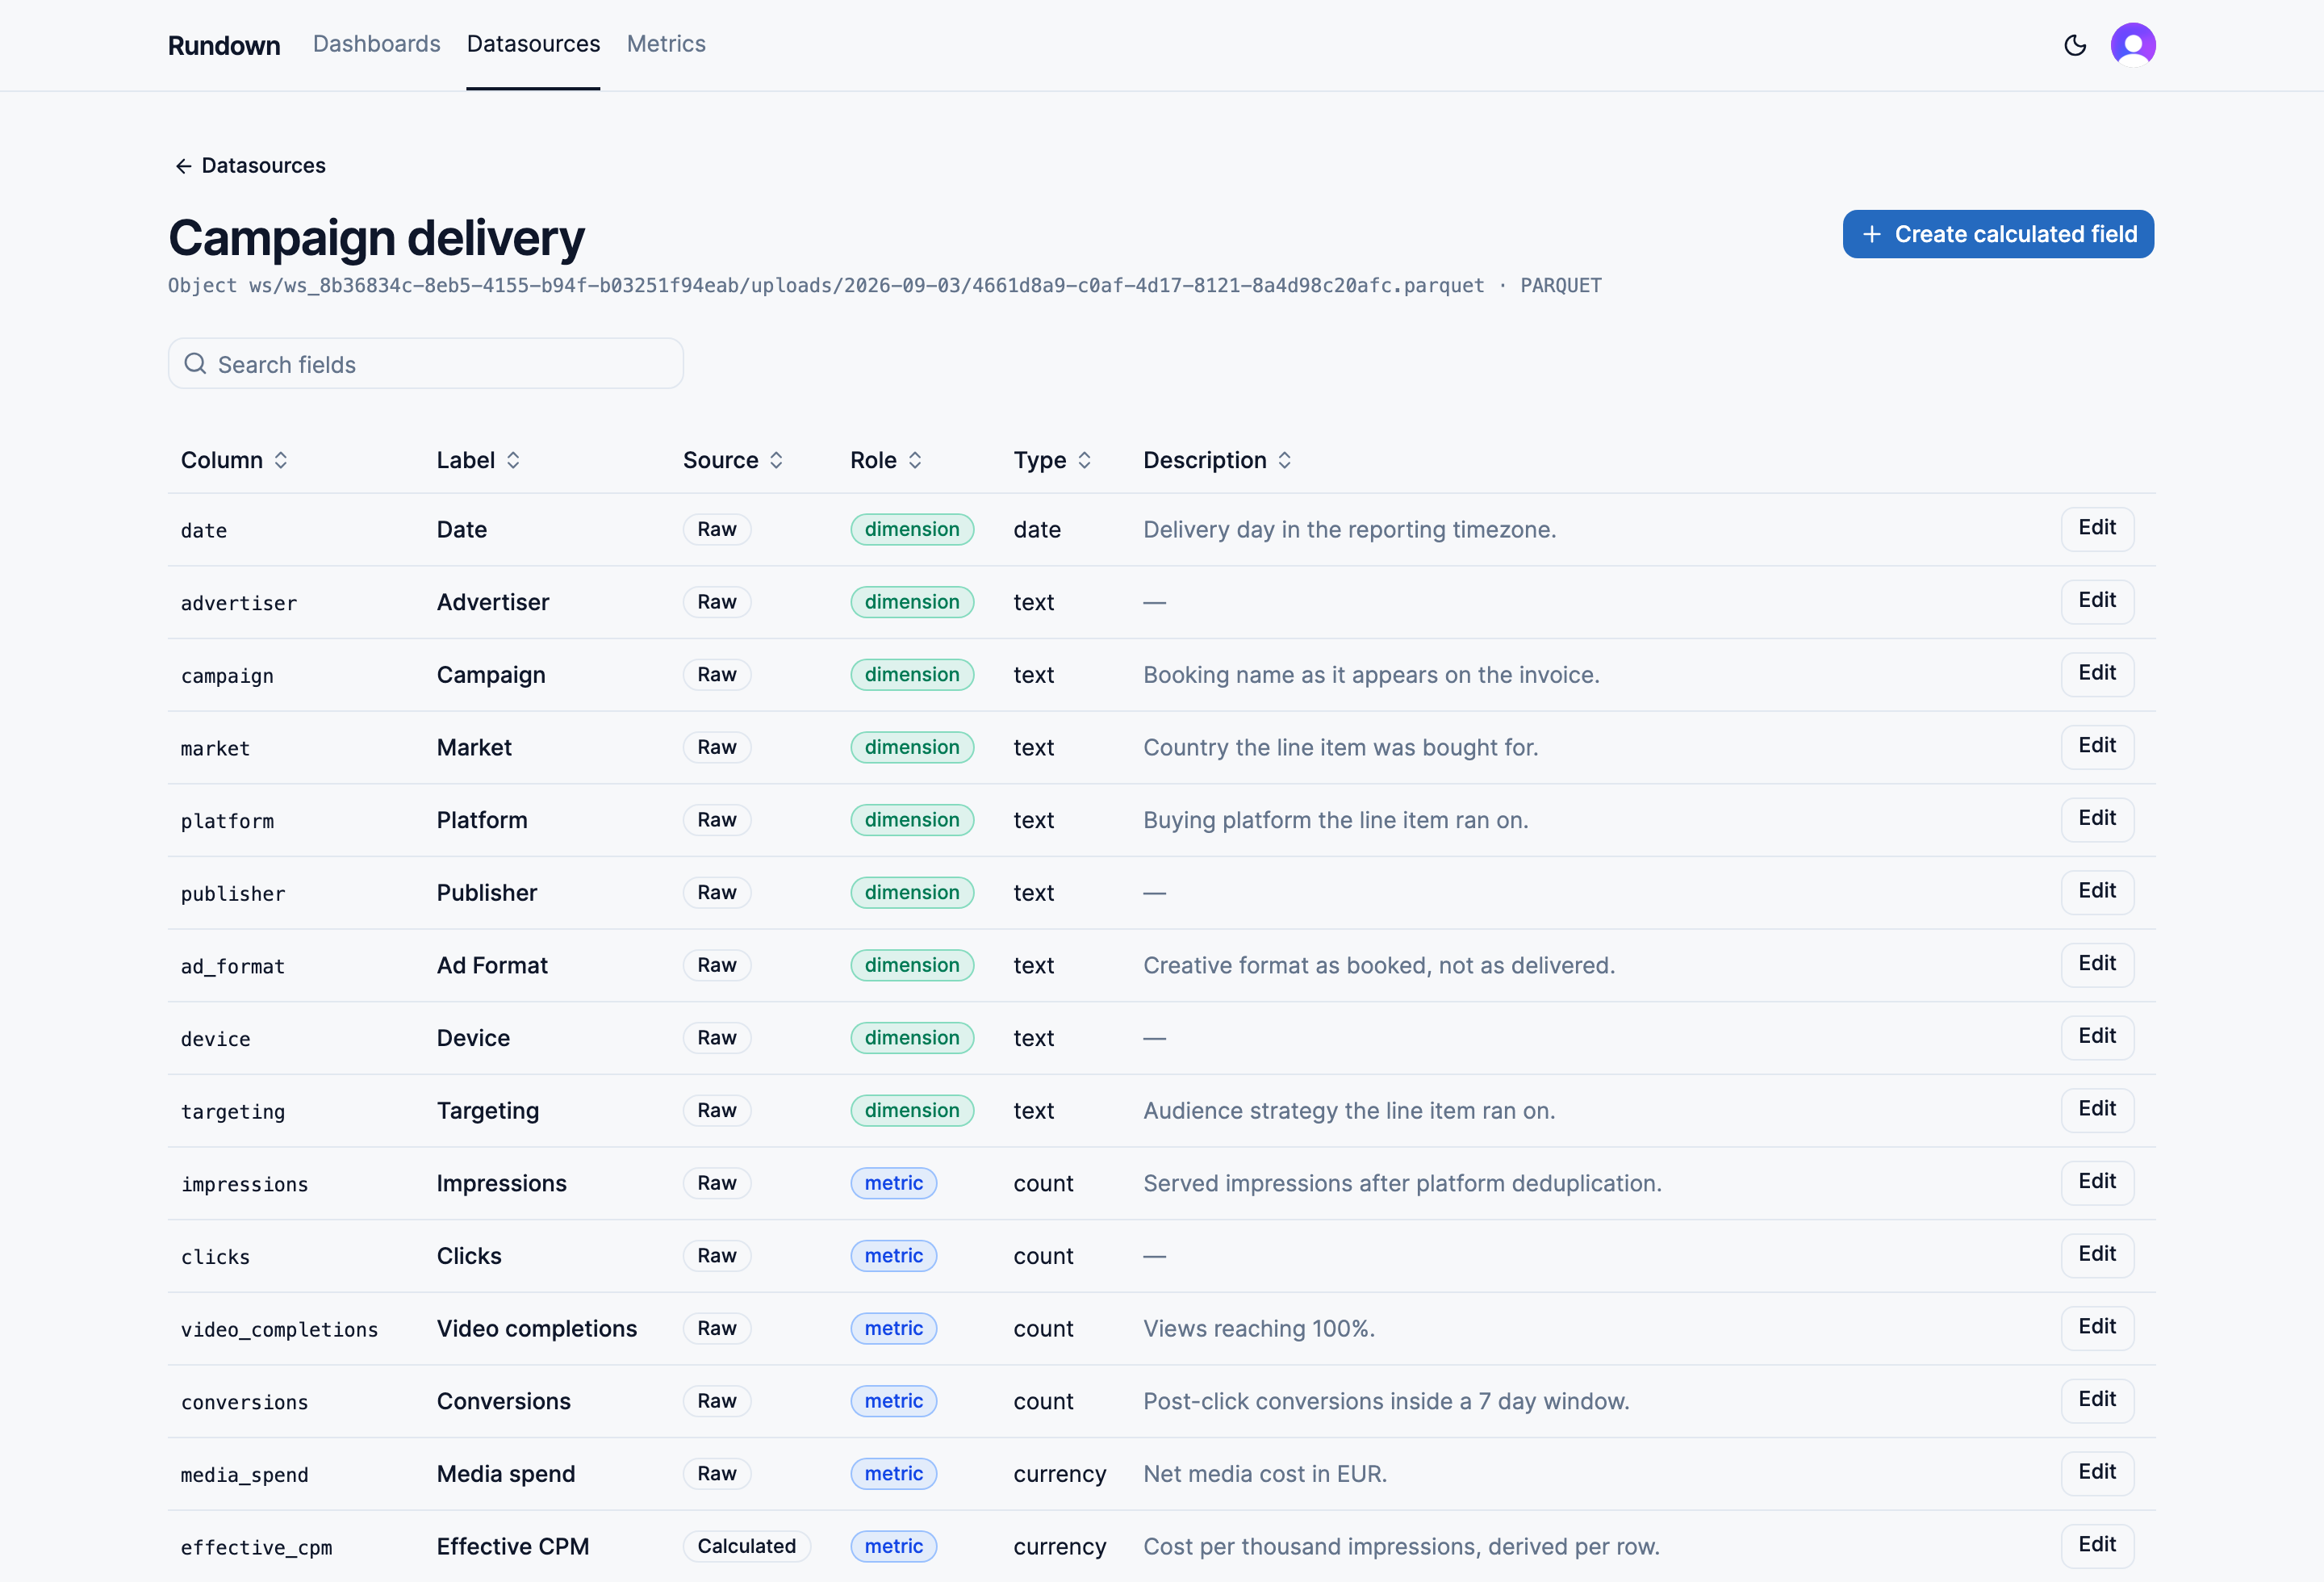
Register a file that already exists, then correct only the labels, roles and types that matter. Every dashboard built on that source follows.